
Curating styles instead of outputs
Dozens of variables perfectly aligning to create the perfect output is one of the most exciting parts of generative art. The perfect composition, colors, lines, shapes; everything working together in harmony. But how often does this actually happen? Generative art can produce infinite possibilities, but it’s not always as great as it sounds. If those perfect outputs are one in a million, then 999,999 of those outputs are going to be less than ideal. Each time a new variable is added, the chances of reaching a perfect output shrink. How do we fix that?
If our outputs are truly random and not curated, we need to make sure each output reaches a quality standard of at least “good”. We should never accept dud outputs because there is a chance of a great one. When one of those great outputs appears, take the time to figure out exactly what variables made it work! This can be as simple as finding what colors work well together, but it can also be more detailed than that. Does a certain stroke weight work well when shapes are a certain size? Are the colors blended in a pleasing way? Is the ratio of filled vs. stroked shapes good? Whatever it is, understand what it is in your code that is causing your output to look good.

Once you understand what variables are contributing to your output looking good, I’ve started creating what I call drawing styles. For example, a drawing style called “Sketch” might only outline shapes, not fill them, and use lines with breaks in them to simulate lines drawn by hand. It might seem counterintuitive to group these lists of hardcoded variables; isn’t that going to limit your outputs? I’ve actually found the result to be the exact opposite.
Another trick is to pick a variable value to apply for all iterations of a function that is called many times, instead of picking a value each time the function is run. For example, let’s imagine a variable X that originally ranges from 100 to 400, and we get a new value of X every time we draw one of a hundred shapes. This means that after we draw our hundred shapes, we will have a pretty uniform distribution of X values from 100 to 400. In each output, we will have X values ranging from 100 to 400. While there is variation in each shape being drawn, each output will actually look similar.
However, if we pull that value of X out of each shape’s logic, and into an overarching drawing style for the output - say X is always 200 for the drawing style “A” - the output will have a distinct look compared to another output where X = 400. This is a simple example, but as you set more and more variable values in each drawing style, they will soon each have their own distinct look. Instead of each output being a mashup of all possibilities, we can tailor the styles to showcase all aspects of our algorithm.
Drawing styles also make it easier to pair multiple outputs together to create a set. You can easily find two pieces in the same drawing style that look similar, but still have their own unique identity. You can also pair outputs of different styles with exterior traits that are the same, like two outputs of different styles that share a common color palette.
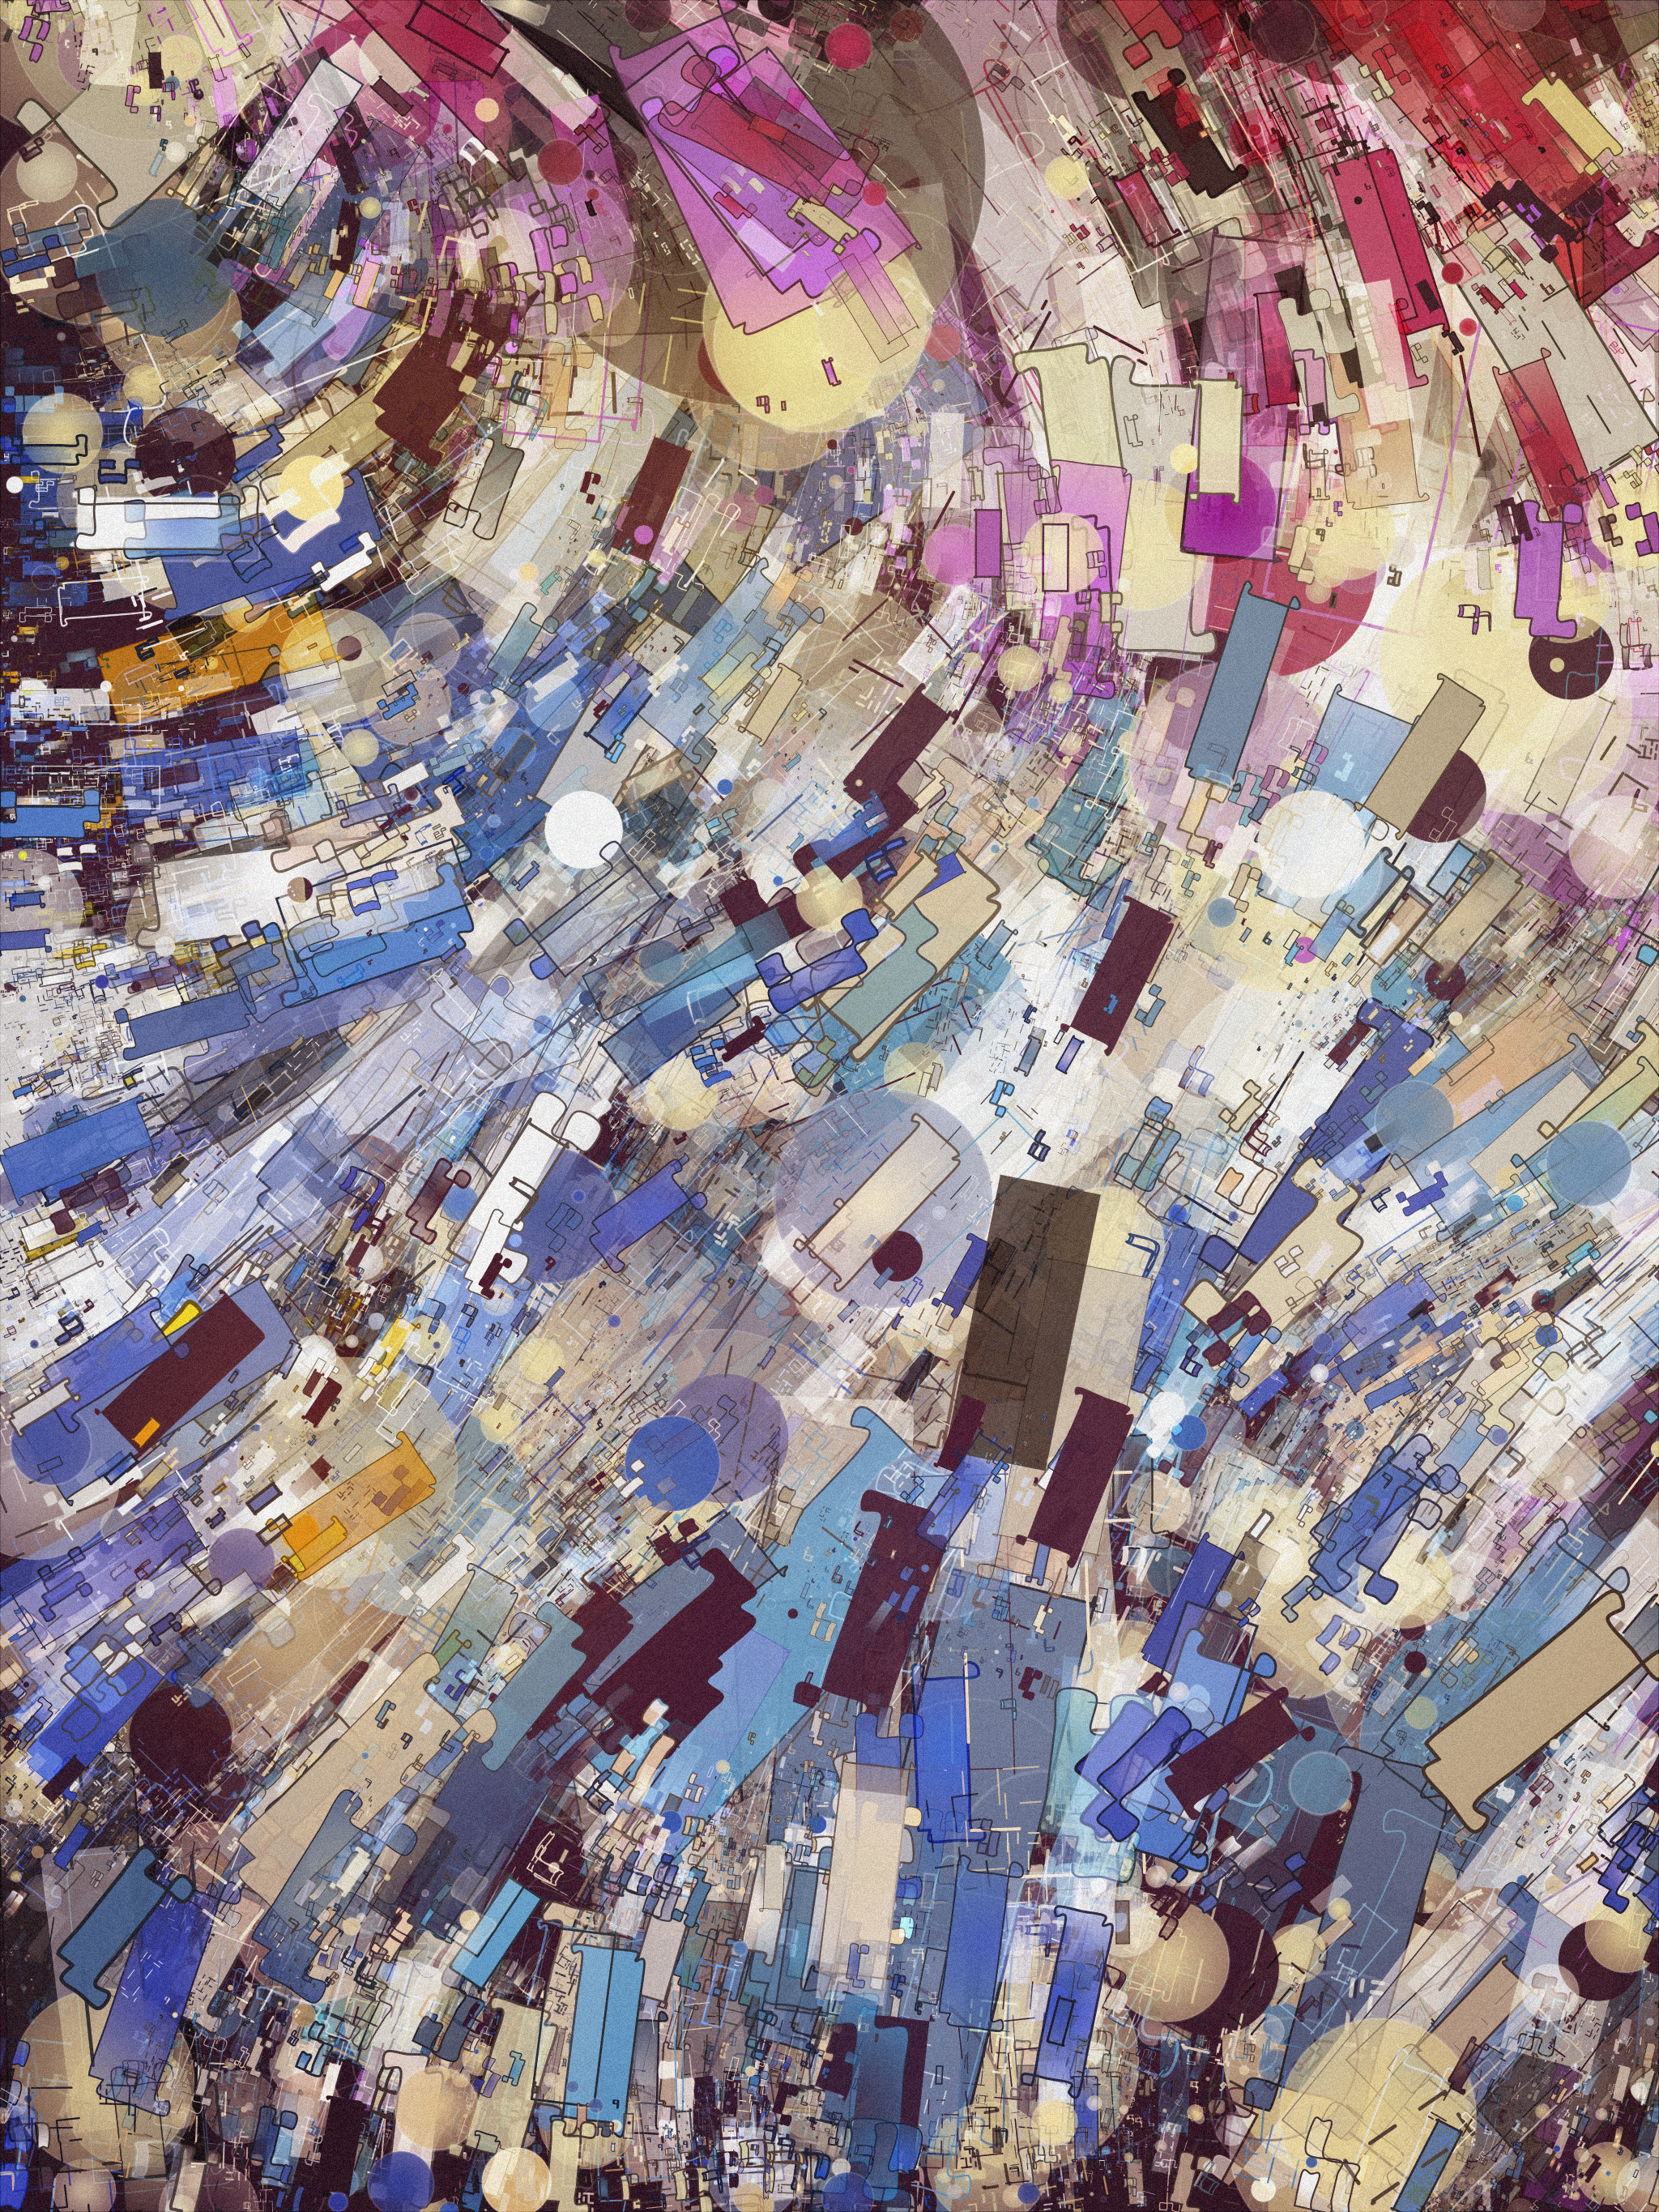
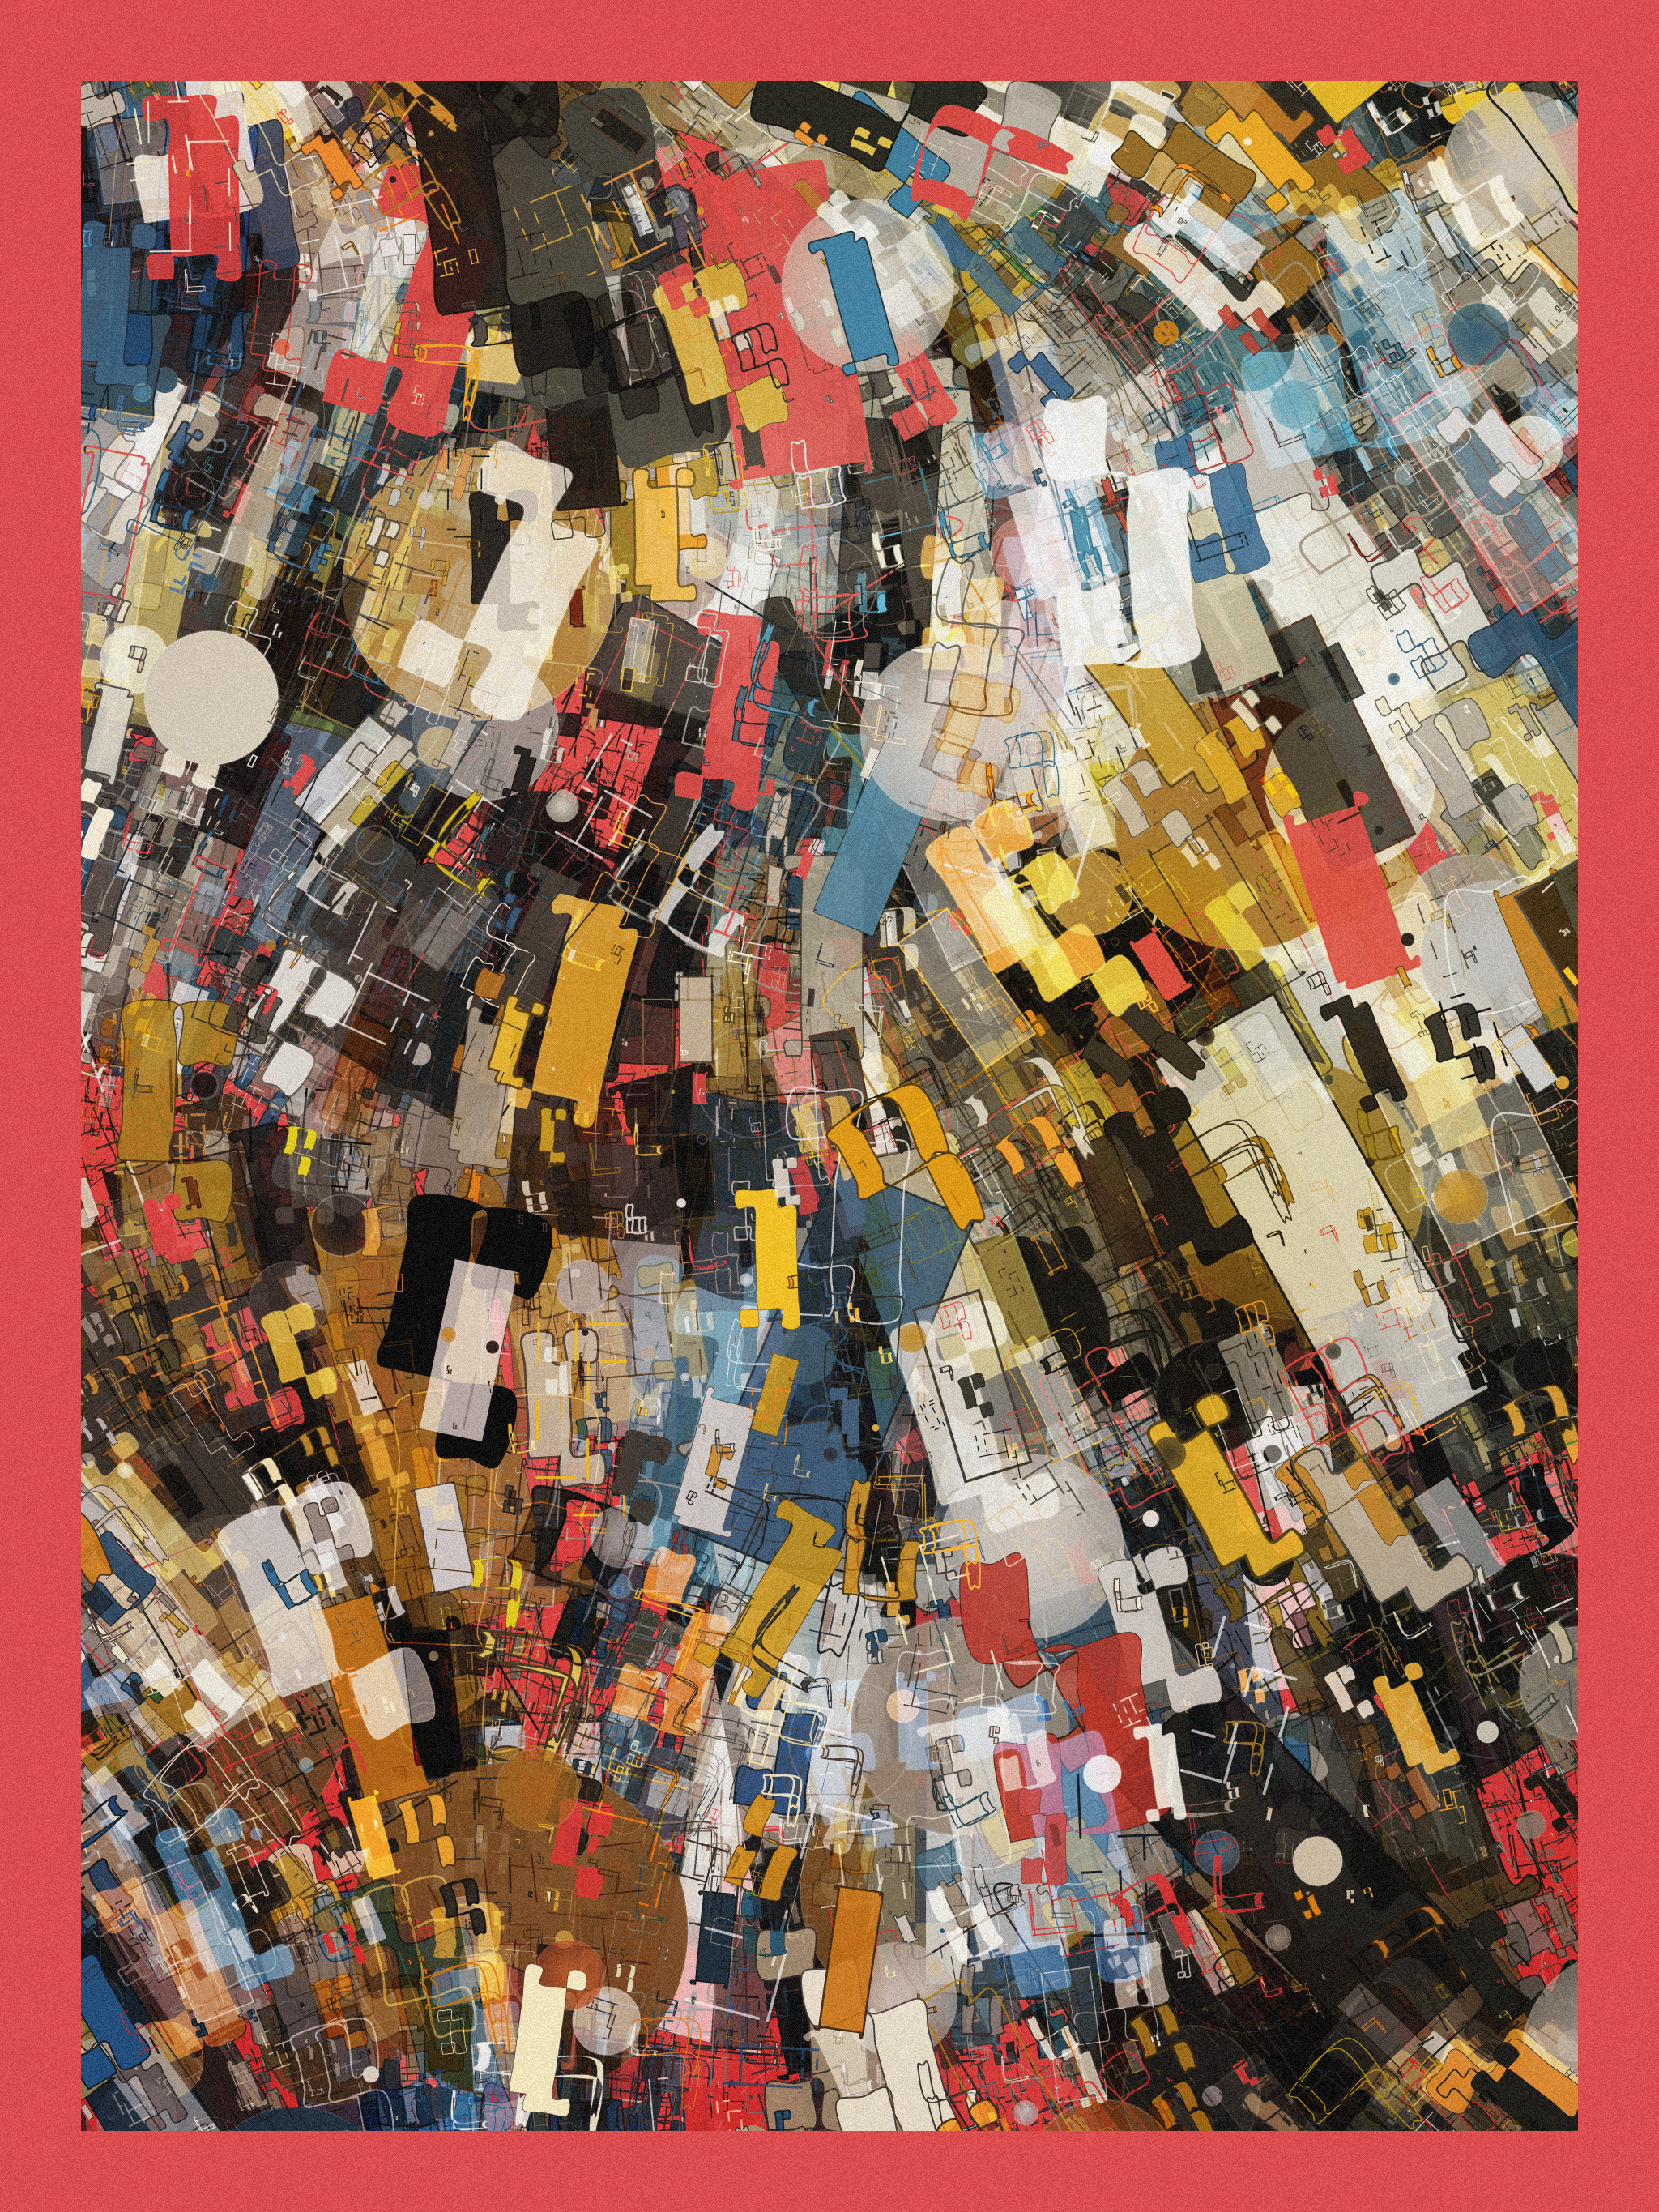
Two outputs with the ‘Flowing’ style
I hope this short explanation has helped! By defining a handful of styles, I get to highlight the strengths of my algorithm, instead of hoping for variables to line up nicely.